
Table of Contents
US employment growth has stalled, prompting widespread calls for interest rate cuts, though recession fears remain muted. Unemployment sits in the low four-percent range - just four or five jobless workers per 100 - which seems manageable on the surface. However, the original Phillips Curve offers crucial insights into how recessions actually develop.
Most economics textbooks present the Phillips Curve as a trade-off between unemployment and inflation, but this reflects a later adaptation of the theory. Phillips' seminal 1958 study actually examined the relationship between unemployment and wage growth - fundamentally a locus of labour market equilibrium. While shedding 4-5% of workers might not immediately disrupt markets, the story changes dramatically if this triggers broader wage stagnation or outright decline. Since consumption depends on income and accounts for over two-thirds of GDP, falling wage growth inevitably drags down economic output.
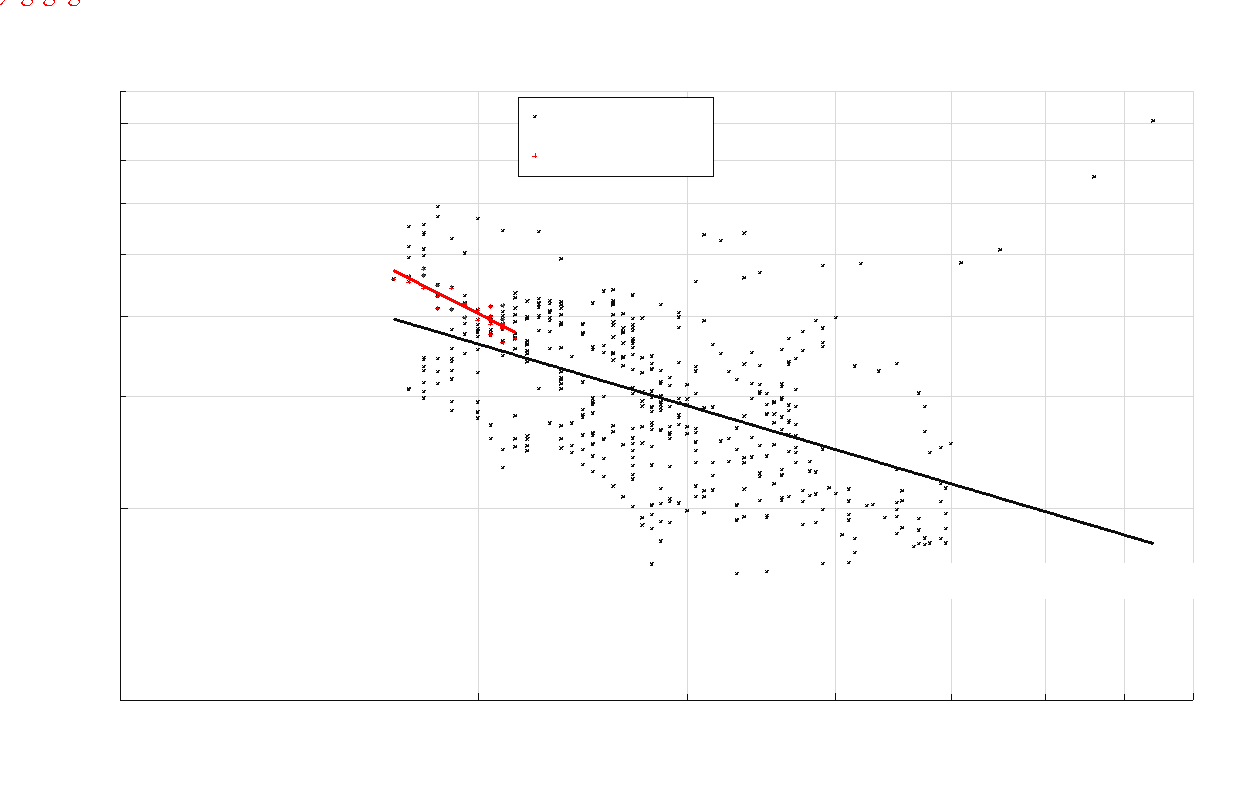
Data from the Great Moderation era - 1984 to present - confirms a clear linear relationship between these variables when plotted on logarithmic scales. Constructing confidence interval around this trend (±2 standard deviations capturing 95% of observations, details omitted from chart for clarity) shows recent years have largely stayed within historical bounds. While the relationship appears to have steepened recently, this remains statistically consistent with past patterns. Claims that AI will drive up unemployment while leaving wage dynamics unchanged might exhibit a rightward shift in this relationship, though more data is needed.
Whether or not such a shift occurs, the mathematics are stark: each 1% rise in unemployment corresponds to a 0.55% drop in wage growth. Crucially, these logarithmic relationships mean percentage changes - so a "1% unemployment rise" means moving from 4.0% to 4.04%, not 4% to 5%. This makes the impact considerable: every 0.1 percentage point increase in headline unemployment represents a 2-3% proportional rise, with similar dynamics for nominal wage growth.
Unlike the modified textbook version, this original Phillips Curve doesn't turn vertical in the long run. The vertical axis captures nominal wage rates rather than pure price inflation, but incorporating real wage effects. When nominal wage growth falls, this reflects declining real GDP growth, falling consumer prices, or some combination. Historical evidence typically shows both price and quantity effects - exactly what we're seeing now, with both inflation and GDP growth moderating. Whether this evolves into outright contraction depends on how much further unemployment climbs.